What's Your Sine? How Sine Waves are used on Oscilloscopes to Represent the Real World
Introduction
Some people say that a technician is only as good as his test instruments. I strongly disagree! In fact, just the opposite is true: a test instrument is only as good as the technician using it.
You can have the best, most expensive, fanciest test instruments in the world, but if you don’t know how to interpret what that instrument is telling you, what good does it do you?
Some techs are using an oscilloscope in appliance repair. Now, I’m all into cool toys but I don’t think we’re at the point in appliance repair where an o-scope is needed just yet. But they are definitely fun to play with!
Properly understood, an oscilloscope can give a skilled tech great insight into what’s going on with a circuit or whatever else you’re measuring, such as sound waves. O-scopes are great for showing different types and shapes of waveforms, including sine waves, chasing signals through a circuit, comparing the timing of two different data trains in digital circuits and lots of other applications. Their real strength is in repairing electronic circuit boards and are often used with a signal generator where a generated signal is injected into a circuit and then inspected at various points in the circuit with an o-scope to troubleshoot a particular problem.
O-scopes can show other things besides voltages such as electronic representations of sound waves. But unless you understand some basics about both sine waves and the physics of what you're looking at with the o-scope, you could draw some blatantly incorrect conclusions. Let's start with sine waves, what they are and what they are not.
Sine Waves: Mathematical Models of the Real World
A sine wave is a mathematical curve that describes a smooth repetitive oscillation. It is named after the trigonometric sine function. You've probably seen a sine wave many times, it looks like this:

All sine waves have common properties such as amplitude, period, and frequency. These are used to quantify (put numbers on) the physical process being analyzed or studied.
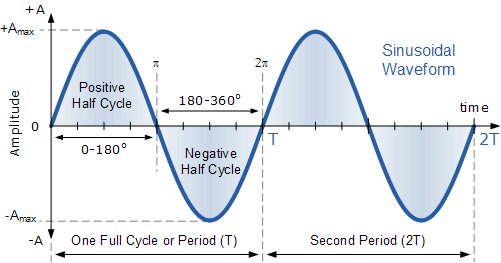
The period is the amount of time it takes for the sine wave to complete one full cycle, its units are time, could be seconds (or some fraction thereof), days, hours, years... depends on what you're modeling. The frequency is the number of of complete cycles completed per unit time, such as 60 cycles per second, also called Hertz (Hz). The amplitude also depends on what you're measuring and the instrument you're using to measure it (more on this later)-- could be volts, decibels, pressure, force, etc.
Sine waves are useful because lots of different physical oscillation processes can be represented by them. Examples are an oscillating spring, AC voltages, ocean waves, planetary rotation, sound waves, light waves, and many others. But the important thing to keep in mind is that in every case, a sine wave is only a mathematical model of some physical reality but is NOT the physical thing itself!
The other thing to keep in mind is that a sine wave is not to be confused with wave physics.
Wave physics is a branch of classical mechanics physics that describes processes that exist as waves in the physical world. A wave is an oscillation (that means is moves back and forth, up and down, you get the idea) of a mass that transfers energy as it moves through some medium, such as air, water, or some other mass. Examples are sound, light, ripples on water, etc.
Although physical waves, such as sound waves, are always three dimensional, they can be mathematically represented as a two-dimensional x-y sine wave plot either on paper, a computer (like a spread sheet), or on an o-scope.
But keep in mind that, in every case, this sine wave representation is just that: a mathematical abstraction of a three-dimensional physical wave phenomena.
But there are lots of other phenomenon in the physical world that do NOT exist as waves-- so wave physics DOES NOT apply-- yet they can still be mathematically represented by sine waves! The most familiar example is AC voltage and current. Since these are not waves, wave physics does not apply. AC voltage and current are explained by the physics of electricity, not wave physics or any other branch of classical mechanics.
Let's look at some examples of the sine wave representations of sound (wave physics) and AC voltage (electrical physics) and compare them.
The Physics of Sound
Sound waves are mechanical vibrations of pressure. They exist in the real world as variations in pressure in a medium such as air. Waves of Increasing pressure are called compression waves; waves of decreasing pressure are called rarefaction waves. These pressure variations produced by the sound source cause movement of the human eardrum and this movement is interpreted by our brains as a sound.
Although sound waves are three dimensional-- they travel outward from the source in all directions-- they can also be represented as a sine wave and plotted on a standard x vs y graph or on a spectrum analyzer or even an o-scope because they have properties of frequency and amplitude. Modeling sound waves as sine waves lets us visualize, quantify, and analyze them.
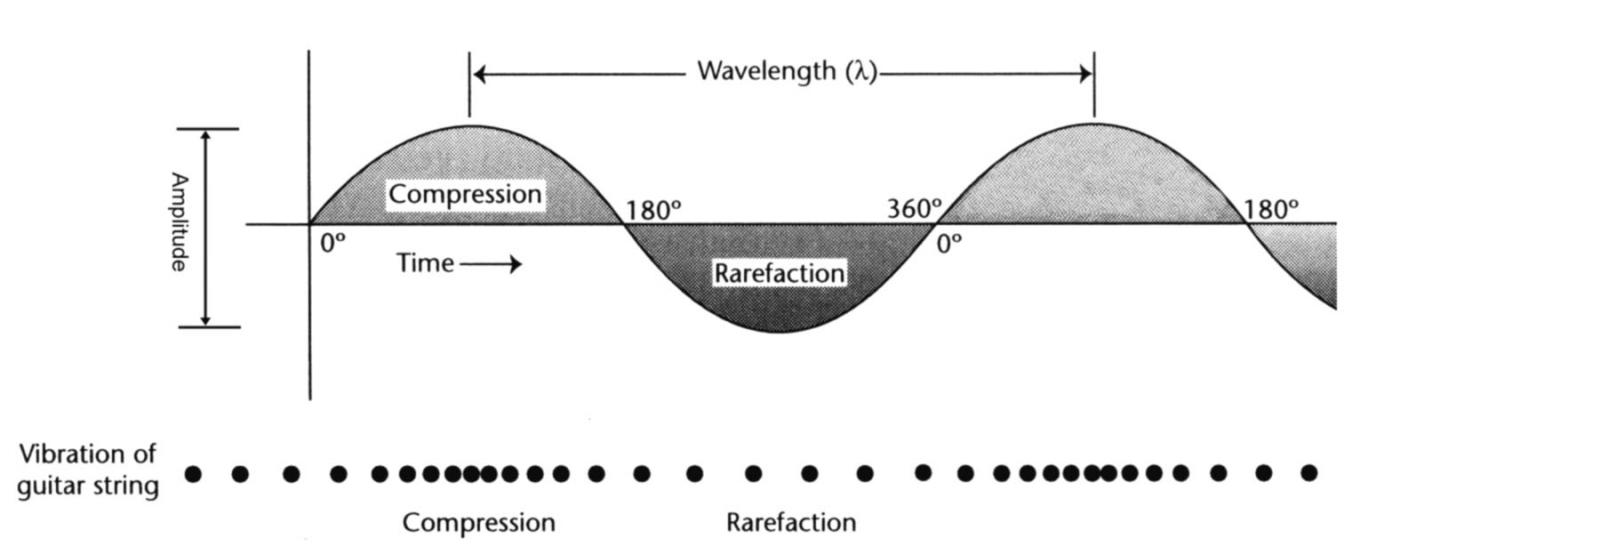
Although we're using a sine wave to model a vibrating guitar string in the image above, the sound produced by that vibrating guitar string doesn't actually look that way-- the sine wave is only a mathematical model of the pressure variations produced by the sound of the vibrating guitar string.
The wavelength (an actual, physical distance measured in meters) determines the frequency-- the longer the wavelength, the lower the frequency because it takes longer for the sine wave to make a complete cycle. Frequency and wavelength are related by the speed of sound: wavelength = speed of sound / frequency.
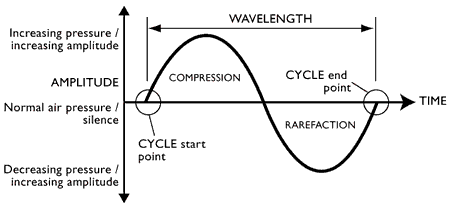
The units of the amplitude of the sine wave representing a sound wave would be some units of pressure, such as decibels. The larger the amplitude, the louder the sound being represented by the sine wave.
But some instruments, such as o-scopes, only have the ability to show volts/division on the vertical (amplitude) axis so that's what will be shown on the screen. But knowing that you're actually looking at a sine wave representation of sound, you would interpret this as a relative index of loudness. This is analogous to the temperature controls on some refrigerators where they only give you a number, such as 1 through 9. The number on the dial, such as "7" doesn't correspond to any actual temperature (as many customers think), it's just an index so you can distinguish one setting from another. Although the sine wave produced by a sound mixer or signal generator actually does have a voltage amplitude, this is to be understood as a substitute for actual sound "loudness," which is measured in units of pressure (most commonly, decibels). For this very reason, some instruments used in sound analysis, such as spectrum analyzers, only show a relative index for amplitude:
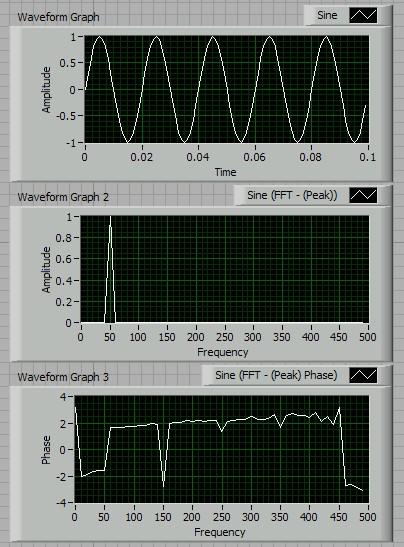
The important take-away point here is that the image being shown on the sine wave graph, such as on an o-scope or spectrum analyzer, is just a model-- an abstraction-- of the actual physical phenomena being shown. So those sine wave models of a sound wave must be interpreted and understood in the context of the actual physics of the phenomena producing the image on the screen.
Note that the waveform graph is two-dimensional but in the real world sound waves are three-dimensional. This graph is exactly how a pure-frequency sound wave would be generated by a sound mixer board and depicted on an o-scope or spectrum analyzer.
The graph indicates a wave traveling along a path from left to right, but real sound waves travel in an expanding sphere from the source. However the 2-dimensional model works fairly well when thinking about how sound travels from one place to another. But, again, the o-scope is just showing you a model, or abstract representation, of the actual, physical sound propagation.
Alright, so we have an idea of some of the physics involved in sound propagation. Let’s explore the question of how sound waves can cancel each other out in the air.
Recall that sound is composed of mechanical compression waves moving through some medium, such as air. That means the wave first compresses to an amount greater than normal air pressure. A sine wave model of this sound would show this as the positive part of the sine wave curve. Then the air expands to a pressure less than normal air pressure. This is the negative part of the sine wave—the part below the zero centerline.
If you have two sounds waves of the exact same frequency and amplitude (volume) but 180 degrees out of phase (one of them is inverted) then one of the sound waves is compressing (higher pressure) at the exact same time the other sound wave is decompressing (lower pressure). Adding the positive pressure from one sound wave and negative pressure from the other sound wave will give you the normal air pressure. The two pressures are cancelling each other out because the air is being decompressed at the exact same time it is being compressed. Since there is no variation in air pressure, there is no sound. This process is called destructive interference and is a basic principle of wave physics.
On a sine wave model of the two sound waves, you would see them as two sine waves 180 degrees out if phase with each other, like this:
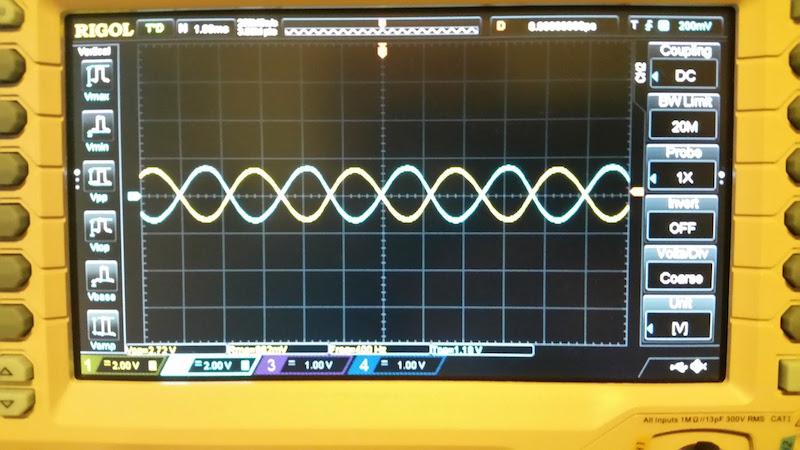
So how can sound waves be displayed on an o-scope? A common method is to use a sound mixer board. A sound mixer is a device that mixes sounds from different sources. Some mixers can also be used to generate sounds of various frequencies. Sound mixers electronically (digitally) reproduce the wave physics of sound. They do this using SUMMING amplifiers that ADD the voltages of the sound frequencies together. It is the electronically manipulated output of a specific type of circuit designed to mimic the physics of sound. This is why they are called sound mixers, not voltage mixers.
So when you use a sound mixer to produce two antiphase sine waves representing sound frequencies, as shown in the photo above, the resulting waveform is seen as a flat line on an o-scope or spectrum analyzer. The sound mixer is doing exactly what it was designed to do: mathematically and electronically produce what you would actually hear in the air (nothing) using good ol' wave physics calculations. Ain't science and technology cool?
From Sound to Voltage
But voltage is not sound! The electronically-manipulated signals from the output of a SUMMING amplifier in a sound mixer has nothing to do with the output of a center-tapped transformer. None of the mechanical wave physics in the foregoing discussion applies to voltage. So things like interference waves, destructive interference, compression, and rarefaction do not apply when you're talking about electricity.
Although sound waves that are 180 degrees out of phase cancel each other in a process called destructive interference, AC voltage is NOT a mechanical wave phenomenon and is not explained by the mechanical wave physics. Yet AC voltage can, and often is, modeled or represented by a sine wave.
To say that because inverted sound waves cancel other out through destructive interference so therefore AC voltage must also behave the same way simply because both can be represented as sine waves is absurd. This would be like saying that because ocean waves can be represented by sine waves, that voltage behaves the same as ocean waves. It's utter balderdash! While this makes for great comedy, it's completely wrong physics. Same sine wave model, different physics. Get it?
The Physics of Voltage
Let’s start by thinking about what voltage is. Voltage is the difference in electric potential energy, in joules, per unit charge, in coulombs, between two points. So a volt is joule/coulomb. There is no type of compression or rarefaction (decompression) happening in electricity.
We never talk about voltage at a single point, it is always relative to some other point, a "reference point", be it ground, Neutral, L2, whatever. For example, there is no absolute 100 volts “out there” somewhere. It is 100 volts relative to some reference point. By convention, we arbitrarily assign a voltage of 0 volts to the earth and all other voltage measurements on planet Earth are relative to this reference.
Electrons, the negatively charged subatomic particles that comprise current flow, are driven by the difference in voltage between two points. It doesn’t matter if one voltage is negative and one positive, both positive, or both negative as long as there is a voltage difference.
As an example, let’s suppose that point A had a steady voltage of +1,000,000 volts and point B also had a steady voltage of +1,000,000 volts. Since both voltages are the same scalar quantity (1,000,000) and polarity (both positive), there is no voltage difference between the two points so no electrons would flow between A and B (or vice versa). The simplified math looks like this:
+1,000,000 volts - (+1,000,000 volts) = 0 volts
Now let’s suppose the voltage at point B is reduced to +500,000 volts. The voltage difference between A and B becomes:
+1,000,000 volts - (+500,000 volts) = 500,000 volts
Since point A is more positive than point B (conversely, you could also say that point B is more negative than point A) the electron flow is from point B to point A.
Now let’s say that point A stays at +1,000,000 volts but point B goes to -1,000,000 volts, the exact same amount of voltage but opposite polarity. Since we’re talking about DC voltage here (i.e., the polarities are fixed over time) we can’t properly talk about phase yet but this would be a DC equivalent, if you will, of two AC voltages being 180 degrees out of phase. Let’s look at the voltage difference between A and B now:
+1,000,000 volts - (-1,000,000 volts) = 2,000,000 volts
The potential difference (or voltage difference, same thing) between A and B quadruples because you’re subtracting a negative voltage. Four times as many electrons are doing all they can to get from point B to point A in this case compared to the case where the voltage difference was only 500,000 volts.
When we deal with AC voltages, the polarities are constantly reversing 120 times a second, twice in each 1/60th of a second cycle. So the same principles we just looked at with the DC examples above would also apply to AC. But with AC, since the voltage polarities are reversing 120 times a second, we have to consider time in our calculations. This is done by referencing the phase of the voltages between two points which is done using either polar or rectangular notation.
Most people, including many techs, assume that single phase means that both 120vac legs in residential application are of the same phase. This is a complete misconception. If the two 120vac legs were in phase, the voltage difference between the two would never change, giving no voltage difference between each hot leg:
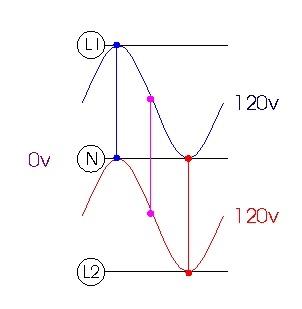
Note that as the vertical line between the sine waves moves from left to right (the horizontal axis represents the passage of time) on the graph, it's "length," representing the voltage difference, never varies so we have no potential difference between the two points (0vac). If this were the incoming power supply to a home, you could never have a 240vac outlet across L1 and L2.
Run the numbers yourself:
Start with the blue segment where each sine wave is at a maximum +120 vac. What's the voltage difference between these two points? +120 vac - (+120 vac) = 0 vac. The voltage difference (or potential difference, same thing) between the two waveforms is zero.
Now go to the red segment where each sine wave is at a maximum - 120 vac. What's the difference now? -120 vac - (120 vac) = 0 vac.
And so on for every point along the two curves, you get the idea. Here again, just a little bit of mathematical literacy let's you see how obvious this is.
Voltage difference is exactly like the name says: the mathematical difference in electrical potential between two points. That means subtracting. When you subtract a positive number from a positive number, the answer (called the difference) gets smaller. When you subtract a negative number from a positive number, the answer gets bigger. I hesitated to even explain this elementary school math but, sadly, it seems to elude many people, even techs, who should know better.
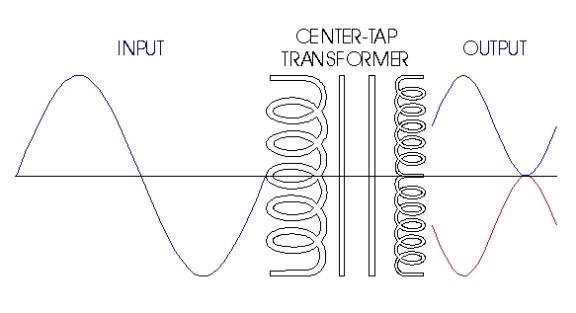
In the step-down transformers used to supply residential single-phase power in North America, the secondary winding of that transformer is center-tapped. The end-to-end voltage on the secondary is 240 VAC. The center-tap on the secondary is the definition of the Neutral wire in household AC power supply systems and it causes two voltages to develop from either end to the center tap, as shown in this diagram:
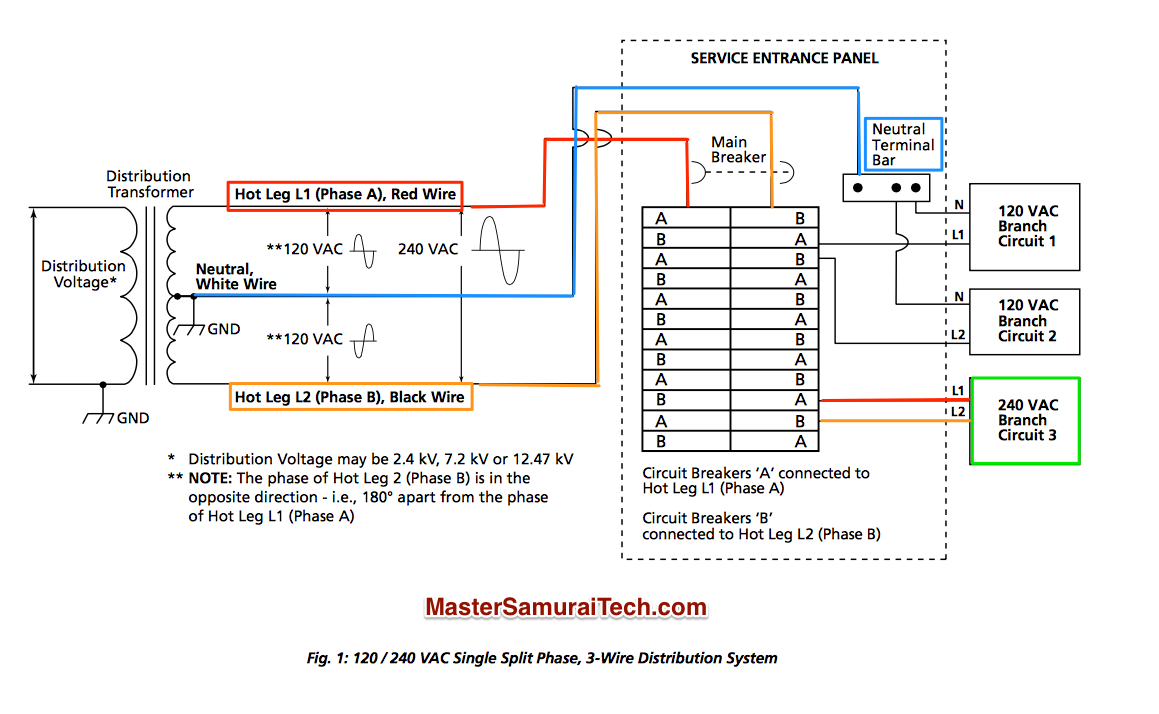
Since the secondary winding is center-tapped, two voltages are developed across each split from either L1 or L2 to Neutral (the center-tap) as shown above. Since the center-tapped Neutral is tied to Ground, the electrical polarity at Neutral never changes-- it is always at Ground potential. However, the electrical polarity at each end of the transformer is changing 120 times a second with reference to Neutral.
Now, let's take a closer look at those voltages being developed across the secondary of the transformer:
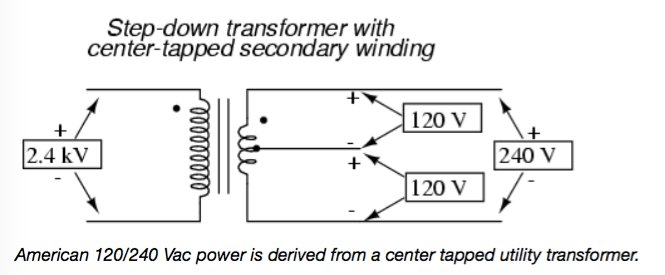
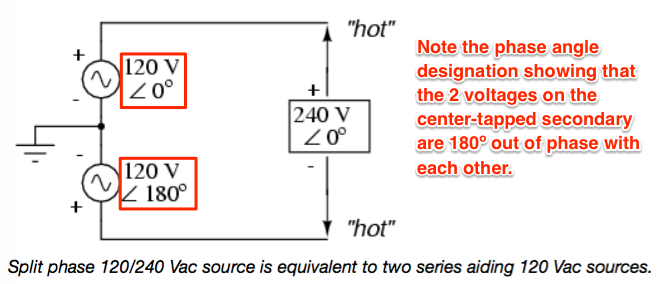
These two voltages are 180º out of phase as shown in this diagram:
This phase relationship between these two voltages can be expressed using phase notation as shown below:
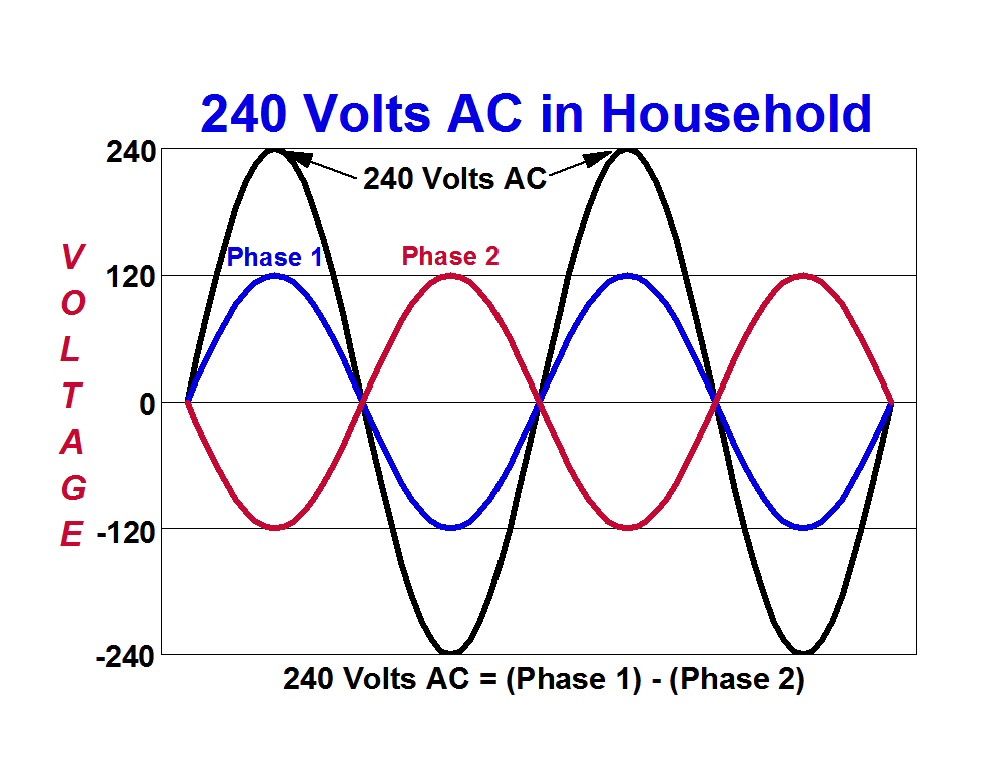
An o-scope, properly configured, would show the two center-tapped voltages as sine waves 180 degrees out of phase with each other. The resultant wave from combining the two waveforms would have an amplitude that is double of either the voltage at A or B.
Watch me demonstrate this in action:
These two voltages can be mathematically combined using either polar or rectangular math. You can do this long-hand as shown below:
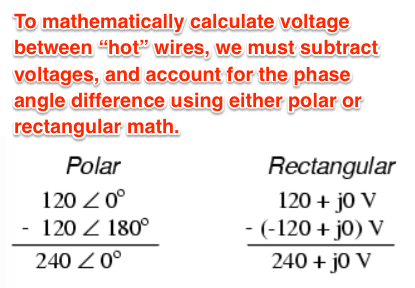
In the special case when voltage sine waves of the same frequency are antiphase (another way of saying "180 degrees out of phase with each other"), you can tell the voltage difference between them at any point by using simple arithmetic. But what about when two voltages are only 120 degrees out of phase with each other, such as in three-phase voltage? Again, you have to use polar or rectangular math to calculate the voltage difference between the two lines at any given point in time. Most engineering calculators will have polar and rectangular functions built into them to facilitate these calculations.
Why should math matter? Why isn't this all just a matter of opinion, preference, or "alternative views?" Because if electricity could not be 100% described by mathematics, none of these systems could be designed in the first place.
How do you think engineers design these systems? Do they guess and hope to get lucky? Do they go with how they're feeling that day? Is it all a matter of how they "believe" these systems work or their "opinion" about how they might work? I guarantee you that they have all this stuff completely nailed down with calculations and they know exactly how the system will behave before the first dollar is committed to building it. That's the essence of what engineers do.
Here again, the abstraction being shown on the o-scope has to be interpreted with an understanding of the physics of the phenomena being viewed, whether sound or voltage.
Summary
- Sine waves are a useful mathematical model used to abstractly represent a wide range of very different physical phenomenon. But the sine wave is not the thing itself-- it is just a mathematical model of the thing.
- By modeling various physical phenomenon as sine waves, scientists, engineers, and technicians can analyze how that physical process changes over time.
- Sound waves, spring compression, AC voltage and current are just a few examples of the widely different physical processes that can all be mathematically and conveniently modeled as a sine wave.
- An oscilloscope is an instrument used to measure the time-varying behavior of various oscillating physical functions and represents them as different types of waveforms, including sine waves.
- Sound waves and AC voltage can both be represented as sine waves with all the various properties of sine waves, such as frequency and amplitude, but this is where the similarity ends.
- Widespread mathematical illiteracy among the population today has resulted in a proliferation of gross misconceptions and "tech myths" about how electricity works.
- O-scopes are fun and, in the right hands, can be a powerful analytical tool. But if you don’t understand the underlying physics of what the sine waves (or other types of wave forms) on the scope are representing or even what a sine wave actually is, you won't know how to interpret what you’re seeing or you will just confuse yourself. Worst of all, you could delude yourself into believing something that just isn't true because you don't know what you don't know.
Professionals working in a skilled trade like appliance repair must have the math and science skills to understand the physical phenomena (electricity, mechanics) that they are measuring with their test instruments or even observing with their senses, or else they can easily get fooled by those observations or measurements and waste time and money in their repair work.
The abysmal public school system in Ameedica today may have let you down by not giving you this foundation, but the Samurai's got your back! Between the Master Samurai Tech Academy and pearls of wisdom such as this post here at Appliantology, I'll help get you up to speed. If I could learn this stuff as a punk-ass, snot-nosed 17-year old kid in the Navy, then anyone can with a little effort and someone to guide them along the way.
Learning never stops, even for the Samurai! Keep your mind open and keep studying so you can know what you don't know.
References:

.png.aa21533c6656a1cb054a172848652cb2.png)


0 Comments
Recommended Comments
There are no comments to display.